Orchestration Dashboard
The dashboard provides more data on the deployments that have been routed via Orchestration and is available to all users that have access to the Orchestration module.
Note
The dashboard will be displayed by default. To create routing rules, click Routing rules from the navigation bar.
Timeframe Filter
Users can view data on the dashboard for the following timeframe options:
Today
Last 7 days
Last 28 days
By default, the timeframe is set to Today and all rule types are displayed. Users can filter rule types by selecting one from the dropdown:
Redirect
Load balance
Block
Users can also filter by currency.
 |
Dashboard Widgets
The dashboard includes five new widgets:
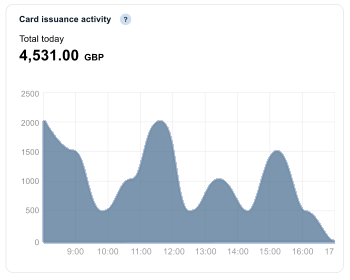
Card issuance activity—a graph displays the total value of all cards that have gone through the routing rules.
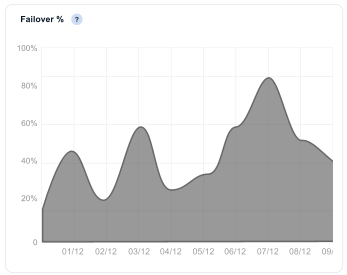
Failover %—a graph displays the percentage of cards that have gone through the failover process.
Payment routing activity—a graphical display of a routing rule journey, from original Card Pool to routed Card Pool or failover Card Pool. Each point of the journey displays the total number of cards.
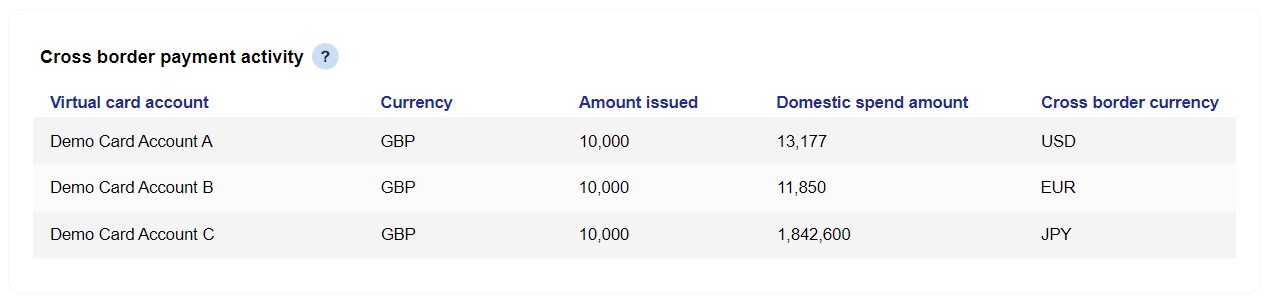
Cross border payment activity—a table view displaying details of deployments where the deployment currency is different to the Card Pool currency:
Currency—displays the Card Pool currency
Amount issued—this refers to the amount issued from the specified Card Pool, in the Card Pool's currency
Domestic spend amount—the value of the card in the deployment currency
Cross border currency—displays the deployment currency
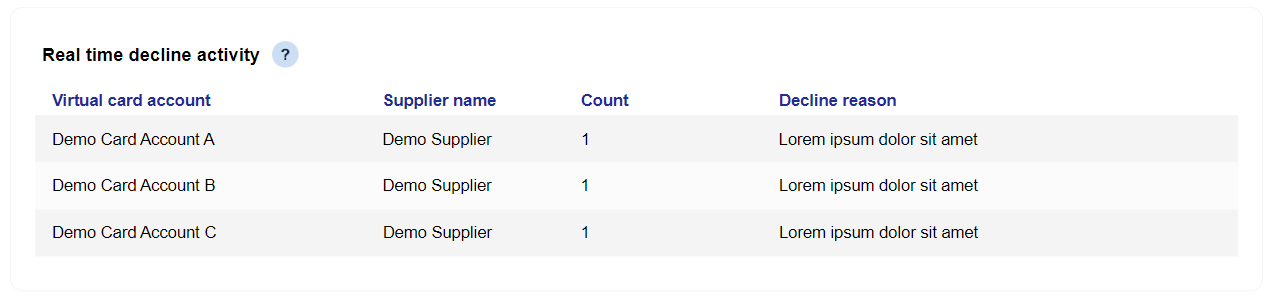
Real-time decline activity—a table displaying details of deployments where a transaction has been declined. A decline reason will also be displayed.